Dietary survey data show differences by region and age, say researchers at the Friedman School of Nutrition Science and Policy at Tufts University.
Summary Sugar-sweetened beverages (SSB) are associated with cardiometabolic diseases and social inequalities. For most countries, recent intake estimates and trends are not available; nor variation due to education or urbanicity. We investigated SSB intake among adults between 1990 and 2018 in 185 countries, stratified at the subnational level by age, sex, education, and rural/urban residence, using data from the Global Dietary Database. In 2018, the global average intake of SSB was 2.7 (8 oz = 248 grams) servings/week (95% IU 2.5-2.9) (range: 0.7 (0.5-1.1 ) in South Asia to 7.8 (7.1-8.6) in Latin America/Caribbean). Intake was higher in men than in women, in young versus older, with a higher level of education than in the less educated, and in urban versus rural adults. Variations by education and urbanicity were greatest in sub-Saharan Africa. Between 1990 and 2018, SSB intake increased by +0.37 (+0.29, +0.47), with the largest increase in sub-Saharan Africa. These findings inform intervention, surveillance and policy actions around the world, highlighting the growing public health problem of sugary drinks in sub-Saharan Africa. |
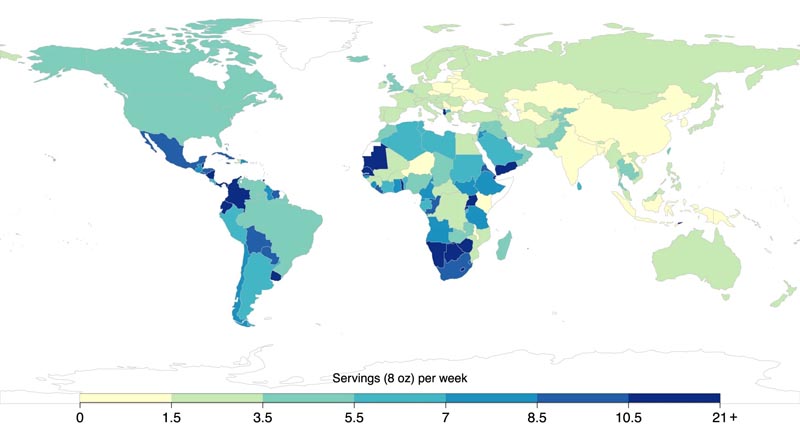
Figure: Sugar-sweetened beverages were defined as any beverage with added sugars and ≥50 kcal per 8-oz serving, including commercial or homemade beverages, soft drinks, energy drinks, fruit drinks, punches, lemonades, and fresh waters. This definition excludes 100% fruit and vegetable juices, artificially sweetened calorie-free beverages, and sweetened milk. The standardized serving size used for this analysis is 8 oz (248 grams). For this visual representation, values were truncated to 21 servings/week to better reflect the distribution of intakes globally. Data analysis was performed using the rworldmap package (v1.3-6). Source data is provided as source data file 1. Oz ounces, SSB sugary drinks.
Comments
The decision to consume a sugary drink is strongly influenced by where you live, researchers at the Friedman School of Nutrition Science and Policy report in a new study published October 3 in the journal Nature Communications . While an analysis of the Global Dietary Database for the years 1990, 2005 and 2018 found that overall consumption of sugary drinks increased (nearly 16% worldwide over the 28-year period studied), regional intake varied widely.
Sugary drinks are a public health problem because they have been widely associated with obesity and cardiometabolic diseases, which are among the leading causes of death and years lost due to disability globally. Many national guidelines recommend limiting added sugars to less than 5 to 10% of daily calories, and because soft drinks add no nutritional value, some countries tax their consumption to help their residents achieve this goal.
The study is the latest snapshot of how adults in 185 countries consume sugary drinks, specifically: soft drinks, energy drinks, fruit juices, punches, lemonades and fresh waters that contain more than 50 calories per serving (8 ounces). Intakes varied widely by region of the world. For example, in 2018, the average person consumed 2.7 servings of sugary drinks per week, but this ranged from 0.7 servings per week in South Asia to 7.8 servings per week in Latin America and the Caribbean.
Overall intake was observed to be higher in men than in women and in younger than in older people, but the role of education and rural/urban residence was more influenced by region of origin. Consumption of sugary drinks was more likely among more educated than less educated adults in sub-Saharan Africa, South Asia, and Latin America and the Caribbean, while the opposite was observed in the Middle East and North Africa. Overall, some of the highest intakes of sugary drinks in the world were among highly educated urban adults in sub-Saharan Africa (12.4 servings per week) and Latin America and the Caribbean (8.5 servings per week). .
Nationally, the countries where people consumed the highest number of servings of sugary drinks per week were Mexico (8.9), Ethiopia (7.1), the United States (4.9), and Nigeria (4.9). compared to India, China and Bangladesh (0.2 each).
“We were surprised by the wide variations by world region in 2018; that Latin America and the Caribbean had the highest intakes at all time points despite an overall decline over time; and that sub-Saharan Africa had the largest increases at all time points,” says first author Laura Lara-Castor, a doctoral candidate in the Friedman School’s Nutrition Epidemiology and Data Science program. "These results suggest that more work is needed, especially around successful interventions such as marketing regulations, food labeling and soft drink taxes."
Data from the Global Dietary Database, which aggregates hundreds of survey results about what people eat and drink, also revealed a relationship between sugary drinks and socioeconomic status. Between 1990 and 2018, the largest increase in consumption occurred in sub-Saharan Africa (+2.99; +81.9%). Intakes rose, then fell in high-income countries and fell, then rose in Latin America and the Caribbean, and in 2018 both returned to levels close to 1990. Other regions of the world had more modest and consistent increases throughout weather. Similar patterns were observed by sex, age, education, and area of residence.
While the study did not identify the reasons for these trends, the researchers hypothesize that the changes could be related to the effectiveness of the food and soft drink industry’s targeted marketing tactics , the association of Western diets with a high status, as well as access to water. "Soft drinks can reach the furthest places, and in countries where drinking water is less accessible, these drinks can sometimes be the only thing available to drink," says Lara-Castor.
"Consumption of sugary drinks has increased in recent decades despite efforts to diminish their appeal," says Dariush Mozaffarian, a cardiologist and Jean Mayer Professor of Nutrition at the Friedman School. "Some populations are especially vulnerable and our findings provide evidence to inform the need and design of national and more targeted policies to reduce their intake worldwide."
Researchers say more work is needed to assess sugary drink intake in children and adolescents, measure the impact of soda taxes globally, and better understand differences between subpopulations in each country. The team also wants to explore how other sweet drinks, such as milk, coffee and tea, influence drinking habits.
The research reported in this article was supported by the Gates Foundation, the American Heart Association, and the National Council for Science and Technology in Mexico. Complete information on authors, funders, methodology and conflicts of interest is available in the published article.
Final message In conclusion, our estimates of sugary beverage intake reveal that global intake increased by 16% between 1990 and 2018, with great heterogeneity by world region and population characteristics. Our findings also provide evidence on national and subnational sugar-sweetened beverage intake, trends over time, and related nutritional inequalities, helping to inform the need and design of national and more targeted policies and approaches to reduce the intake of sugary drinks around the world, highlighting the growing problem of sugary drinks for the public. Health in sub-Saharan Africa. |